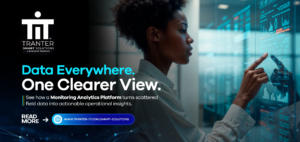
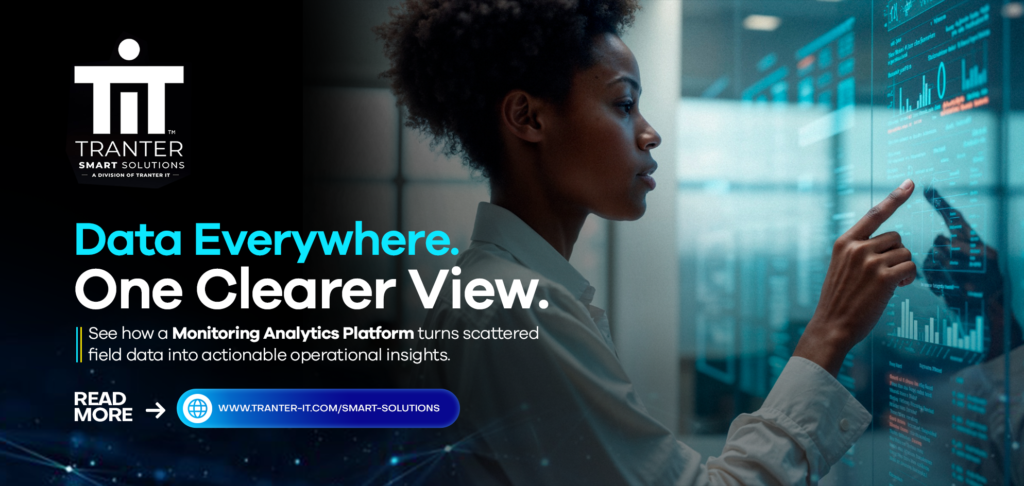
A pressure reading changes at one wellhead while flow begins to shift at another. At the storage area, tank levels are moving in a different direction, and somewhere else on the site, temperature data is telling another part of the story. A Monitoring Analytics Platform can bring these separate signals together, giving operations teams a clearer view of what is happening across the field.
The individual readings are useful. However, when they remain spread across different systems, locations or manual reports, it becomes harder to see how they relate to one another. A change that looks insignificant on its own may become important when viewed alongside other operational data.
That is the challenge facing many Oil & Gas teams. Data is being generated across the field, yet having more data does not automatically provide better visibility. What matters is whether the right information can be seen together, understood quickly and used to support a decision.
When Field Data Exists but Visibility Is Missing
Oil & Gas operations can generate a large amount of information every day.
Pressure may be measured at wellheads. Temperature can be monitored around process equipment. Flow data can indicate changes in production, while tank-level readings provide visibility into storage.
The problem begins when these readings are handled separately.
For example, an operator may notice that pressure at one asset has changed. To understand whether the change matters, they may also need to check flow rates, temperature readings and historical data.
If those sources are disconnected, that simple investigation can take longer than it should.
Meanwhile, routine information may still depend on manual checks, periodic reporting or visits to remote locations. These processes can create gaps between what is happening in the field and what decision-makers can see.
The result is not necessarily a lack of information. Instead, it is a lack of connected operational visibility.
The Real Problem Is Not More Data: Why a Monitoring Analytics Platform Matters
The value of better monitoring becomes clearer when you look at the scale of the information Oil & Gas operations need to manage.
According to the International Energy Agency’s Global Methane Tracker 2026, the energy sector emitted nearly 150 million tonnes of methane in 2025. Oil operations accounted for around 44 million tonnes, while natural gas activities contributed close to 34 million tonnes.
These figures show why visibility across field operations matters. When emissions can come from multiple assets and processes, teams need reliable information to identify changes, investigate potential problems and understand where attention is required.
The IEA also explains that its latest methane estimates draw on satellite observations, measurement campaigns and other data sources. This demonstrates the growing importance of combining different sources of information to build a clearer picture of what is happening across energy operations.
For Oil & Gas operators, the lesson is straightforward. Monitoring is not simply about collecting more readings. It is about bringing relevant information together so that changes can be identified, understood and acted upon.
A Monitoring Analytics Platform supports this approach by bringing data from connected field devices and assets into a central operational view.
How a Monitoring Analytics Platform Creates a Clearer View
A Monitoring Analytics Platform brings relevant data from connected devices and field assets into a central environment.
Sensors can capture information such as pressure, temperature, flow and tank levels. Field gateways can then transmit that information to the appropriate analytics environment, where it can be visualised through dashboards and other reporting tools.
Instead of checking multiple sources, an operator can access related information from one place.
That creates several practical benefits.
Faster access to field information
Remote assets can be monitored without requiring personnel to visit every location simply to collect routine readings.
This can reduce the time spent on manual data gathering while giving teams more frequent access to operational information.
Better understanding of trends
A single reading provides a snapshot.
A series of readings provides a trend.
That difference matters. When historical information is available, teams can compare current conditions with previous performance and identify changes that might otherwise be overlooked.
Easier comparison across assets
When information from several connected assets is presented within the same environment, unusual patterns can be easier to identify.
An operator may notice that one wellhead is behaving differently from similar assets, for example. That observation can then prompt further investigation.
More informed decision-making
Good operational decisions depend on context.
By bringing relevant measurements together, monitoring analytics can give teams more information before they decide whether an issue requires attention, further investigation or immediate action.
Where Smart Monitoring Can Be Applied
The same approach can support several areas of an Oil & Gas operation.
Remote asset monitoring
Wellheads, production equipment and other remote assets can generate valuable information without requiring constant physical inspection.
Remote monitoring can provide visibility into key parameters and help teams understand changes between scheduled site visits.
Flow and production monitoring
Flow measurements can help teams understand how processes are behaving over time.
When flow information is viewed alongside other operational data, changes can be investigated with greater context.
Tank-level monitoring
Storage levels can be monitored remotely, providing teams with a clearer view of inventory conditions.
This can be particularly useful where tanks are distributed across locations or where frequent manual checks are inefficient.
Environmental monitoring
Temperature and other environmental parameters can also be monitored through connected systems.
When these readings are brought into a central environment, teams can track conditions and review changes over time.
The specific application may differ, but the principle remains the same: connect useful field data, make it visible and turn it into information that supports action.
What This Looks Like in Practice
Imagine an operations team responsible for several remote production assets.
Previously, routine readings were collected from different locations. Some information was recorded manually, while other data was available through separate systems.
When an unusual pressure reading appeared, the team had to gather additional information before deciding what it meant.
That process created delays.
Now, imagine those assets connected to a central monitoring environment.
Pressure, temperature and flow readings can be viewed together. Historical information provides additional context, while dashboards give the team a clearer picture of current conditions.
If pressure changes unexpectedly, the operator does not have to start from a blank page. They can immediately look at related readings and recent trends.
The technology has not replaced the operator’s judgement.
Instead, it has given that judgement better information to work with.
Visibility Should Lead to Action
A dashboard full of numbers is not necessarily a good monitoring system.
If users cannot quickly understand what they are seeing, the technology can create another layer of complexity.
That is why effective monitoring should focus on the information that matters most to the operation.
Relevant measurements should be presented clearly. Trends should be easy to interpret. Data should be available to the people responsible for making decisions.
Furthermore, the system should support the way teams actually work.
For a remote Oil & Gas operation, that may mean giving field and management teams access to the same operational information. For another application, it may mean tracking energy consumption, asset behaviour or environmental conditions from a central location.
The technology can vary. The objective remains consistent: make operational information easier to see, understand and use.
Turning Field Data into Operational Insight
The remote pressure, temperature and flow data has been integrated into analytics environments to improve operational visibility across connected field assets.
The broader opportunity goes beyond simply monitoring a reading.
When field data is connected and presented in context, teams can spend less time searching for information and more time interpreting it. They can identify trends, investigate changes and make decisions with a clearer understanding of what is happening across the operation.
That is where smart monitoring becomes genuinely useful.
It is not about creating another screen for operators to watch. It is about giving them a better way to understand the assets they are responsible for.
Conclusion: Better Decisions Start with Better Visibility
Field operations will continue to generate data from more sensors, assets and locations.
However, collecting that information is only the beginning.
A Monitoring Analytics Platform can bring distributed field readings into a central operational view, helping teams see relationships between pressure, temperature, flow, tank levels and other important parameters.
More importantly, it can turn isolated readings into useful context.
When teams can see what is happening across their assets, they are better positioned to investigate changes, identify trends and decide what needs attention.
The goal, therefore, should not be to collect as much data as possible.
The goal is to make the right data visible when it matters, so better information can lead to better operational decisions.